
Collecting docker logs and stats with Splunk
- modified:
- reading: 5 minutes
UPDATE: Take a look on our applications for monitoring Docker and Kubernetes https://www.outcoldsolutions.com
I’m currently working at Splunk, but this is my personal blog. I have some knowledge about Splunk obviously, but you should not consider this as an official Splunk manual. Everything I did here - I did only for my personal needs and my free time.
You cannot really feel safe for the services you run if you don’t monitor them. There are plenty of great tools which allow you to monitor your docker environments, like cadvisor and some other cloud solutions. I did not want to use cloud solutions, because they can also upload some sensitive information, like environment variables, where I could keep passwords for AWS backups. So I wanted to use something like cadvisor, but with historical information and also attached logs for the containers. I could not find anything which just works out of box, so I decided to start working on my own solution, which is built on top of Splunk Light.
Splunk Light is free if you need to index less than 500Mb, which will be more
than enough for home use.
Settings up Splunk Light
First of all we need to setup Splunk Light. I have build my own Splunk docker
image (on GitHub).
You can use it to setup your Splunk Light container, this is my
docker-compose.yml example
vsplunk:
  image: busybox
  volumes:
    - /opt/splunk/etc
    - /opt/splunk/var

splunk:
  hostname: splunk
  image: outcoldman/splunk:6.2-light
  volumes_from:
    - vsplunk
  ports:
    - 8000:8000
    - 9997:9997
  restart: always
I have two containers here, I usually use Data Volume Containers to persist data. So first container is a Data Volume Container, second container is a Splunk Light. For Splunk Light I opened two ports:
8000for web access.9997for data from forwarders.
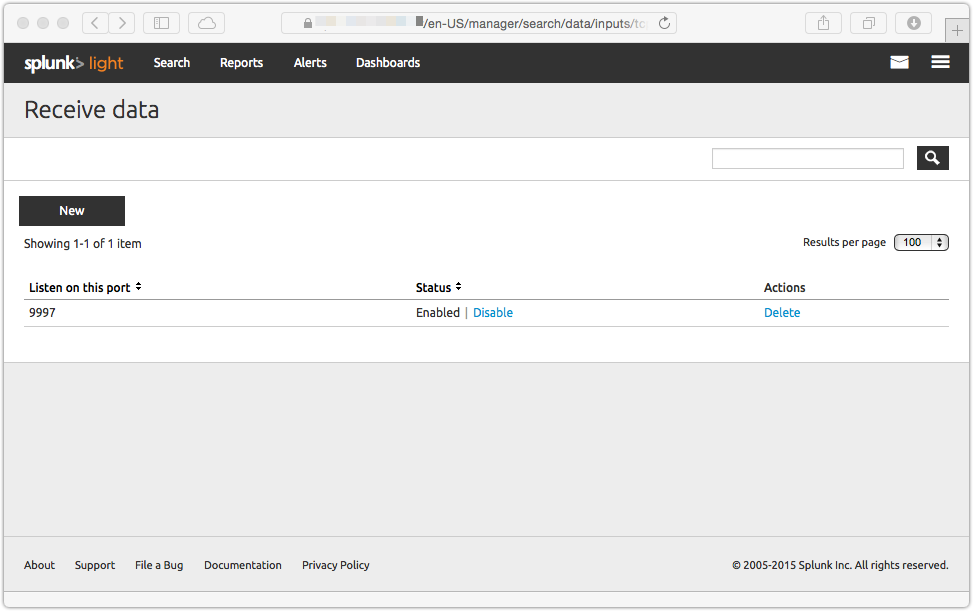
To enable receiving data on this Splunk Light, just go to the Settings (it is
on right top corner), Data, Receiving, after that click on New and
add port 9997.
Settings up Splunk Forwarder to collect syslog data
The next set of containers which we want to setup is a Splunk Forwarder which will forward logs from syslog to Splunk. We can actually directly collect them from first Splunk container, but I prefer to separate them.
My docker-compose.yml file for Splunk Forwarder (again using my Splunk image)
vforwarder:
  image: busybox
  volumes:
    - /opt/splunk/etc
    - /opt/splunk/var

forwarder:
  image: outcoldman/splunk:6.2-forwarder
  environment:
    - SPLUNK_FORWARD_SERVER=YOUR_DOCKER_HOSTNAME:9997
  volumes_from:
    - vforwarder
  ports:
    - 514:1514/udp
  restart: always
This image will use internal 1514 port for listening UDP traffic (syslog) instead
of 514, because I run Splunk processes not under root and only root can get
access to ports under 1024. But I still want to keep port 514 on host, because
some applications does not allow you to change receiving port (like DD-WRT router).
Remember port 9997 which we just specified above? This image automatically will
forward all logs to this port (just don’t forget to replace YOUR_DOCKER_HOSTNAME).
Now we need to enable listening on port 1514
docker exec -it splunk_forwarder_1 entrypoint.sh splunk add udp 1514 -sourcetype syslog
Forwarding logs from docker containers to Splunk
I usually keep default docker logging driver and only forward logs for specific containers, as I’m not interesting in all of them.
Example of my nginx proxy container is
nginx:
  image: nginx
  ports:
    - 80:80
    - 443:443
  volumes_from:
    - vdata
  restart: always
  log_driver: syslog
  log_opt:
    syslog-tag: nginxproxy_nginx
    syslog-address: udp://MY_DOCKER_HOST
On previous chapter we mapped port 1514 to default syslog port on my docker
host machine, so for this container we just need to forward logs to the syslog
on current host and it will go to the Splunk Forwarder.
As you can see I also use syslog-tag which allows me to identify the right logs in syslog. The format of these logs will be something like
Aug 23 23:44:36 172.17.42.1 2015-08-23T16:44:36-07:00 docker_host_name docker/nginxproxy_nginx[2156]: LOG LINE
After that it will be easy to parse logs.
Forwarding logs from applications to Splunk
If application in your container does not write logs to the stdout and keep
them in files you still can use Splunk Forwarder to monitor these files.
I will show you how to do that on GitLab example. It keeps all logs under
/var/log/gitlab. So what we should do is to share these data in Data Volume
Container between GitLab and Splunk forwarder images.
vlogs:
  image: busybox
  volumes:
    - /var/log/gitlab
After that we just need to add Splunk Forwarder
vforwarder:
  image: busybox
  volumes:
    - /opt/splunk/etc
    - /opt/splunk/var

forwarder:
  hostname: gitlab
  image: outcoldman/splunk:6.2-forwarder
  environment:
    - SPLUNK_FORWARD_SERVER=YOUR_DOCKER_HOSTNAME:9997
  volumes_from:
    - vlogs
    - vforwarder
  restart: always
And the last step, just tell Splunk Forwarder to monitor /var/log/gitlab/ by
docker exec -it YOUR_CONTAINER_NAME entrypoint.sh splunk add monitor "/var/log/gitlab/"
That is it. You should see your logs on the indexer after that.
NOTE: I’m thinking about automating step of automatically monitoring specified with environment variable folders/files. Probably will do that soon.
Forwarding docker stats and events
Another docker container I built is a Splunk Forwarder with preconfigured inputs,
which monitors for the Docker stats, like top, inspect, stats and events.
You can find this container on Docker Registry outcoldman/docker-stats-splunk-forwarder/
(or GitHub. It
is very simple to set it up
dockerforwarder:
  hostname: docker
  image: outcoldman/docker-stats-splunk-forwarder
  volumes:
    - /var/run/docker.sock:/var/run/docker.sock:ro
  environment:
    - SPLUNK_FORWARD_SERVER=YOUR_DOCKER_HOSTNAME:9997
  restart: always
After that you will see all events in Splunk Indexer.
Some useful dashboards based on Docker stats
I’m still working on preconfigured Splunk Light image with all dashboards, or maybe Docker applications, but for now I can just share few Searches I use for my Dashboards.
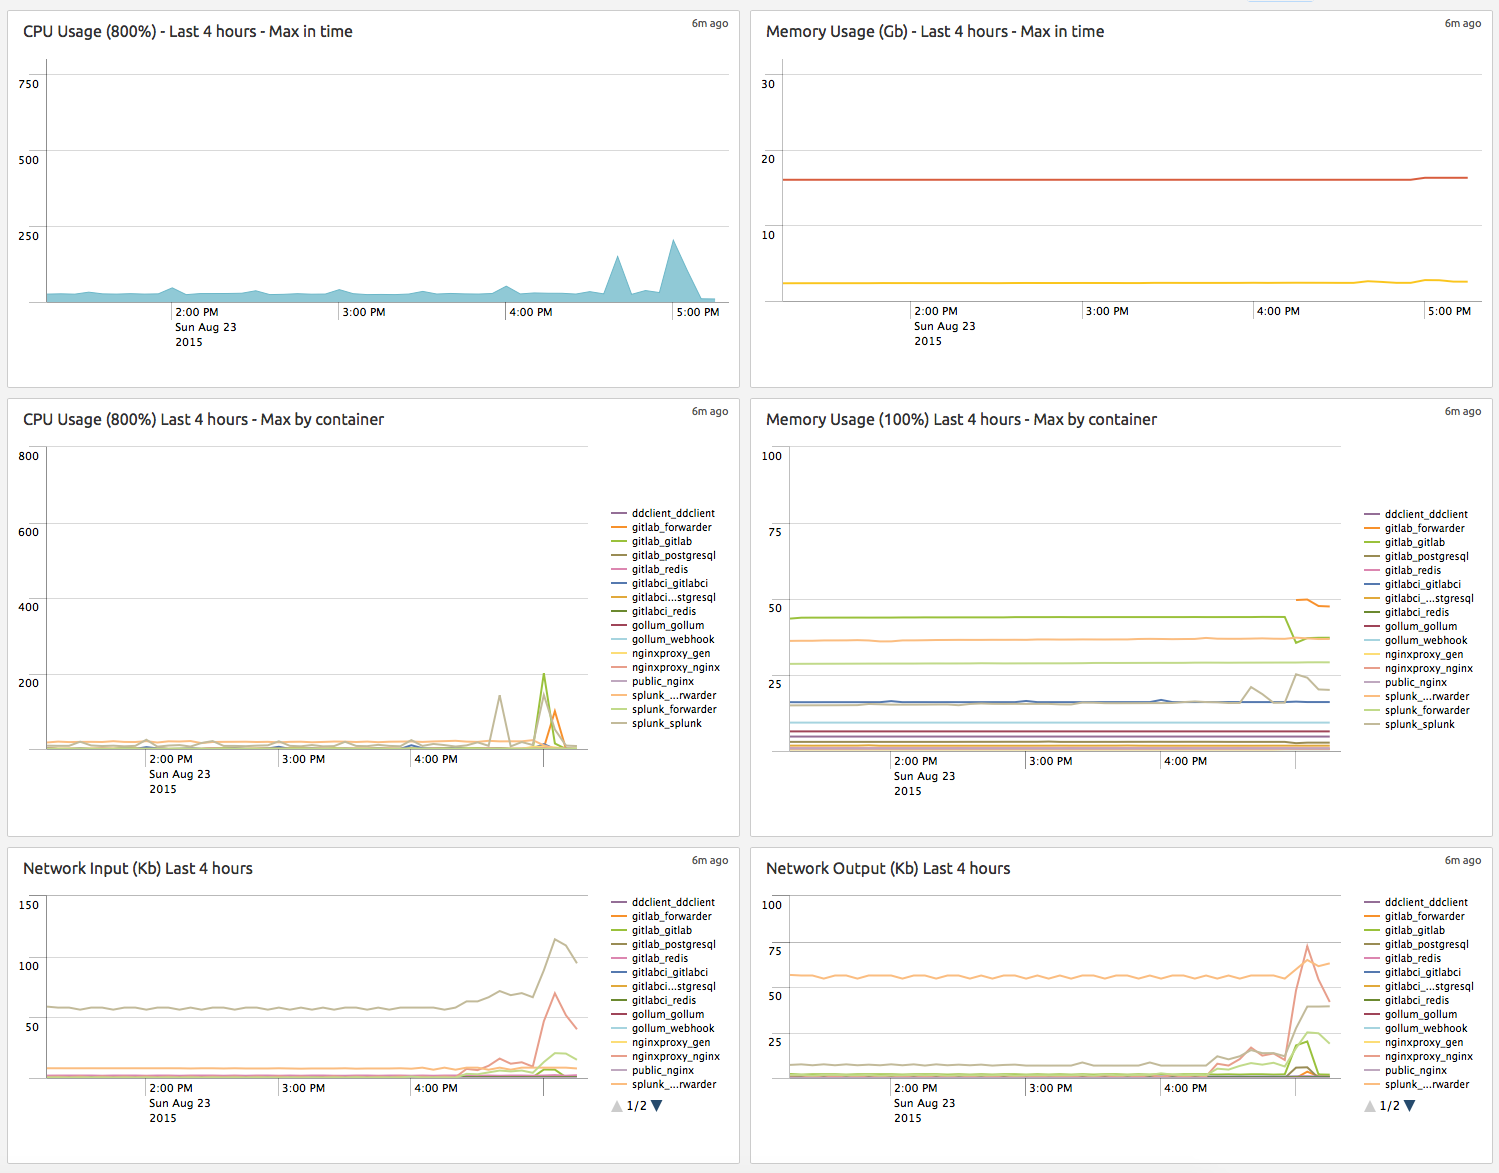
These two screenshots of overall Docker information:
- CPU% (800% because of 8 cores)
- Memory Usage (one line is the maximum limit, another is how much is used right now)
- CPU usage per container
- Memory Usage per container (% of limit)
- Network Input per container
- Network Output per container
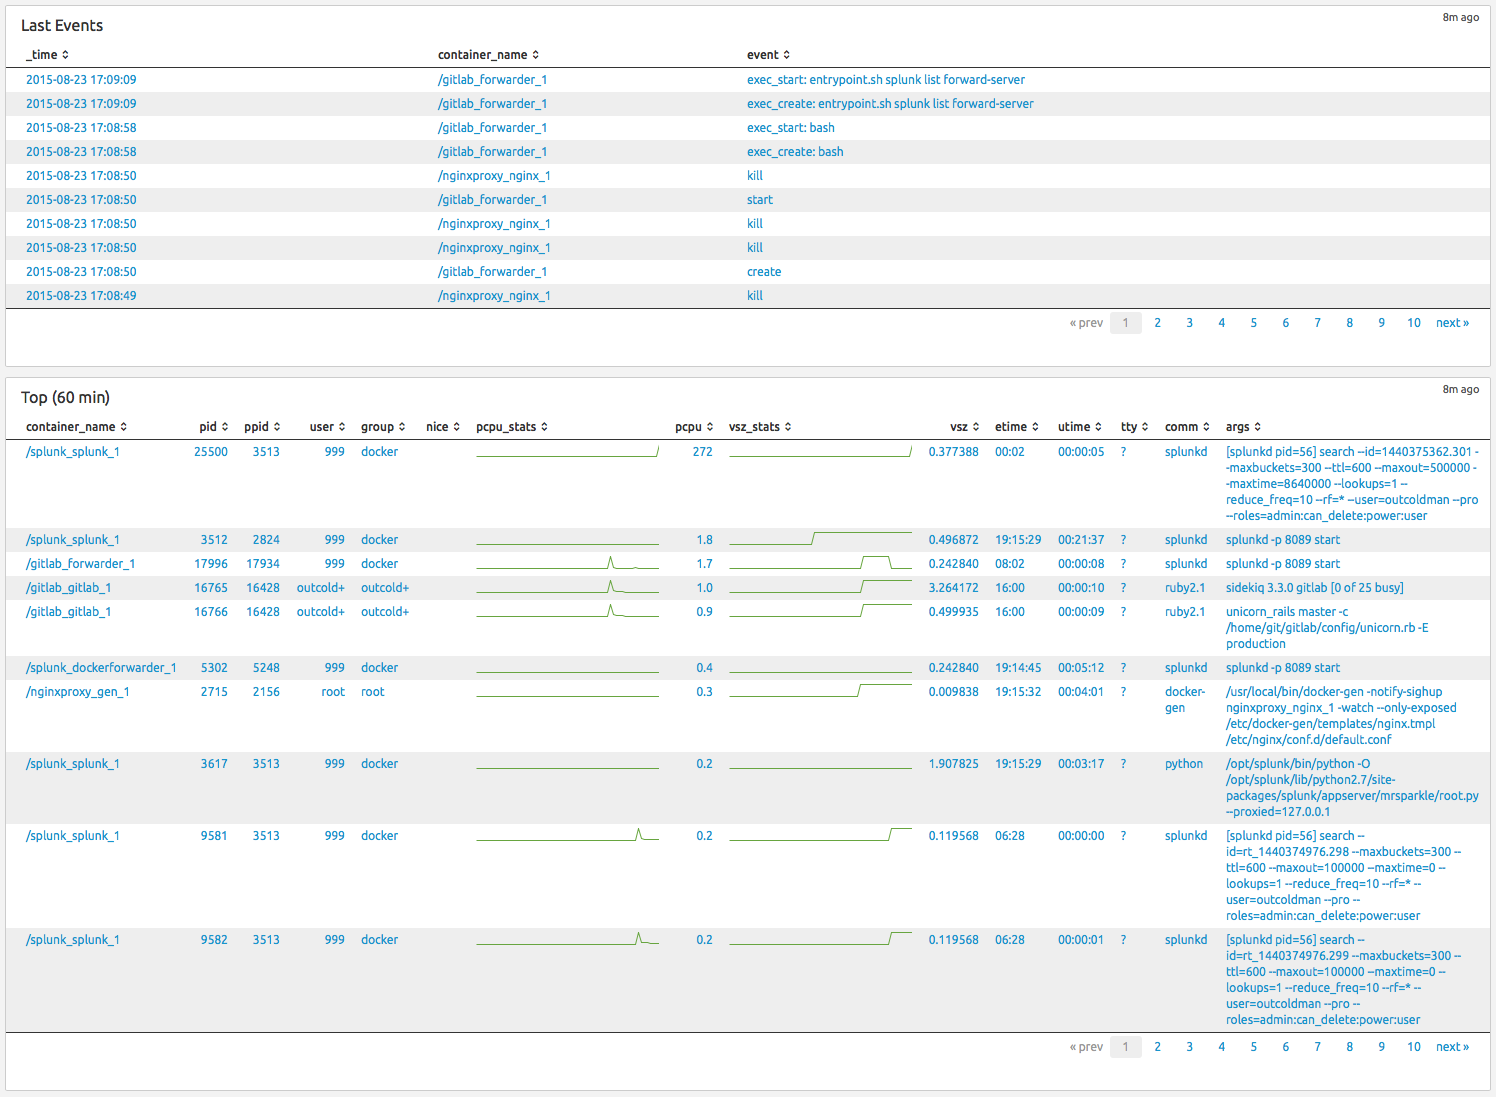
- Last Events (excluding
topas I query it regularly) - Top processes from all container
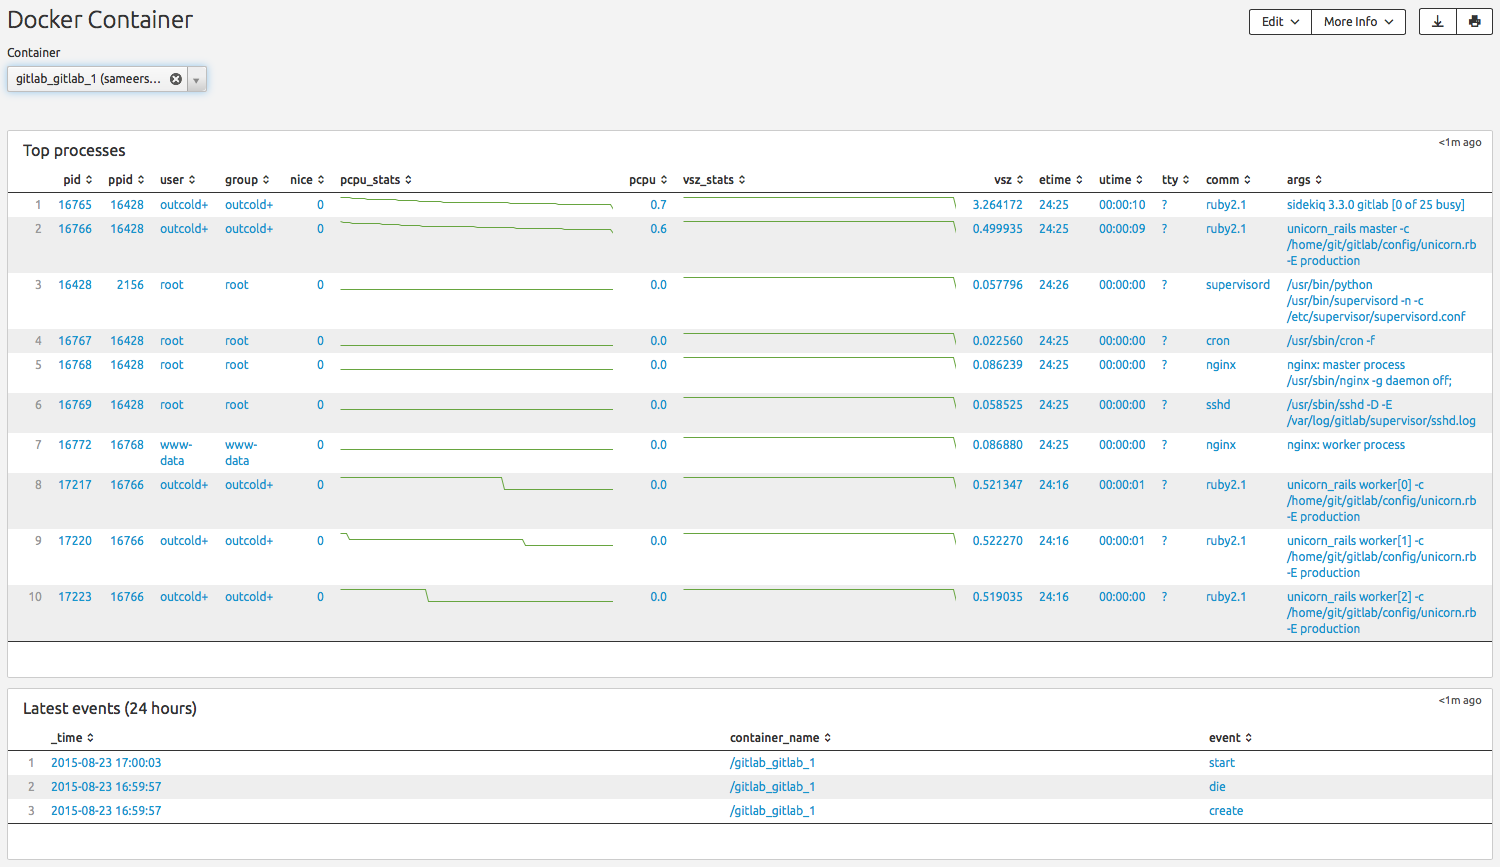
Also I worked on Dashboard for containers, select container and you will see
- Top processes
- Last events
To try them out you can use outcoldman/docker-stats-splunk which is Splunk Light image with predefined Dashboards.